showcase
Click the icon to view a Live Demo or GitHub repository.


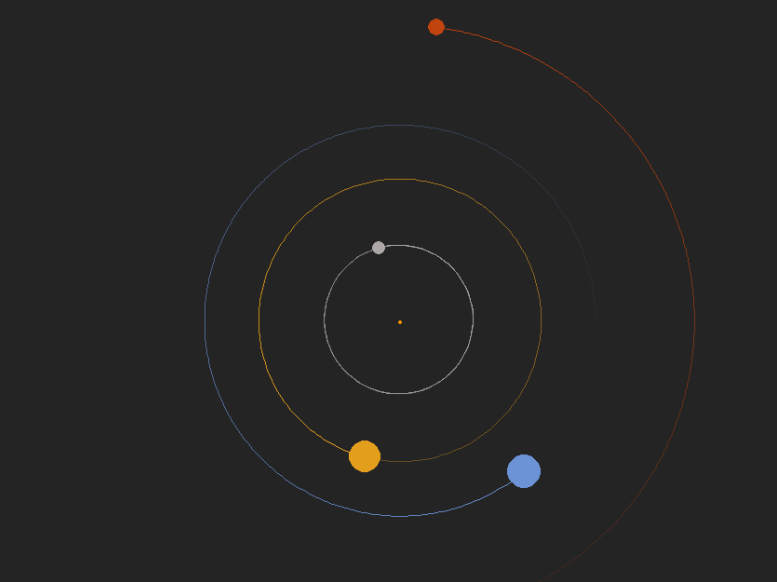
solar-system-sim
Astronomy
Simulation
Web App
Repository 🢅
More info.
- Simulation
- Planetary motion
- Basic physics
- NASA data
Astronomy
Simulation
Web App
Repository 🢅
Welcome! I’m a chemistry student with a passion for self-taught coding.
My work centers on interactive dashboards, data visualizations, simulations, and creative coding projects. This site showcases my journey in building tools and applications—from visualizing renewable energy trends and simulating the solar system, to tracking cryptocurrency prices and creating practical utilities.
Explore my projects to see how I combine curiosity for science and technology with hands-on coding.
Explore my growing collection of web apps, interactive simulations, and creative coding projects.
From data dashboards to scientific visualizations, each project reflects my curiosity and passion for building with code.
Check out more of my work on https://github.com/kuranez
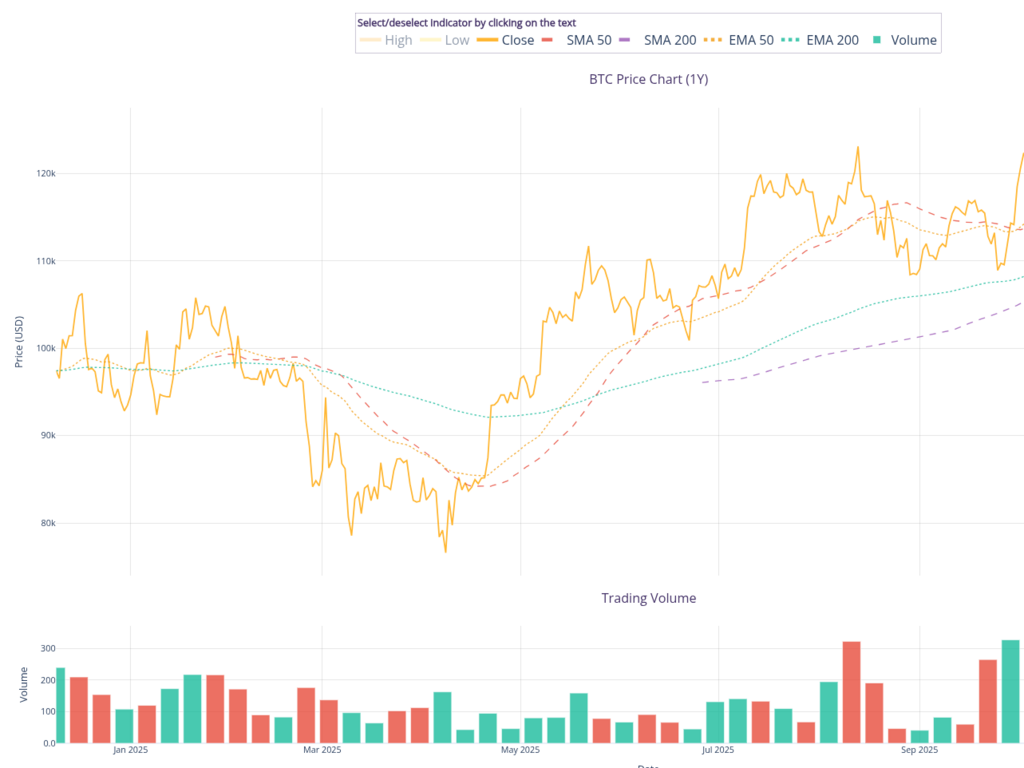
krypto-dashboard is an interactive web application for tracking and analyzing cryptocurrency price trends in real time.
The platform combines powerful data analysis with dynamic visualization tools to deliver clear, actionable insights into a wide range of cryptocurrencies. Users can explore historical price data, monitor current market action, and compare multiple assets side by side – all within a responsive and user-friendly interface.
Built with Python, Panel, and Plotly, Krypto Dashboard is designed for robust performance and smooth user experience. It empowers users to stay informed and make better decisions by presenting complex market data in an accessible, visual format.
https://apps.kuracodez.space/krypto-dashboard (Live Demo)
https://github.com/kuranez/krypto-dashboard-webapp (Web Version)
https://github.com/kuranez/krypto-dashboard (Jupyter Notebook Version)
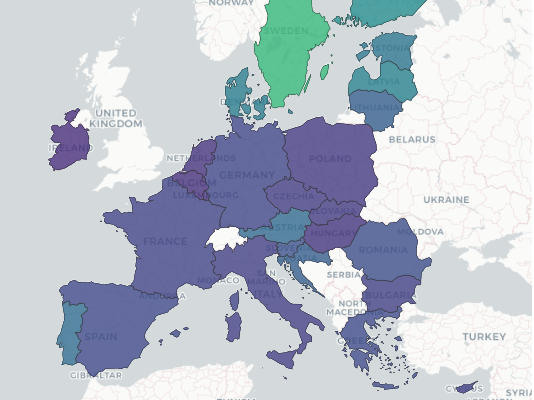
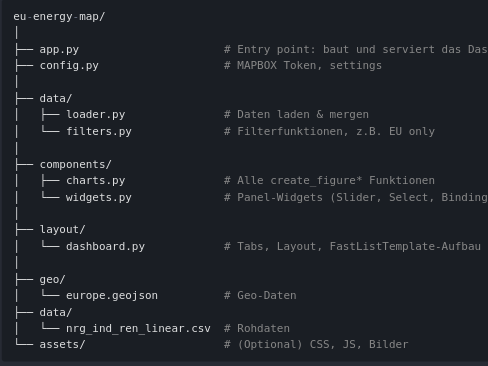
eu-energy-map is an interactive dashboard that visualizes renewable energy trends across the European Union.
This project combines data analysis and visualization to provide clear insights into how different EU countries are progressing towards sustainable energy goals.
Built using Jupyter Notebook and Python, the dashboard makes it easy to explore up-to-date data on renewable energy production, compare countries, and identify trends at a glance.
https://apps.kuracodez.space/eu-energy-map
https://github.com/kuranez/eu-energy-map